1
 |
MARSHALL28 United States. Feb 06 2008 20:37. Posts 1904 | | |
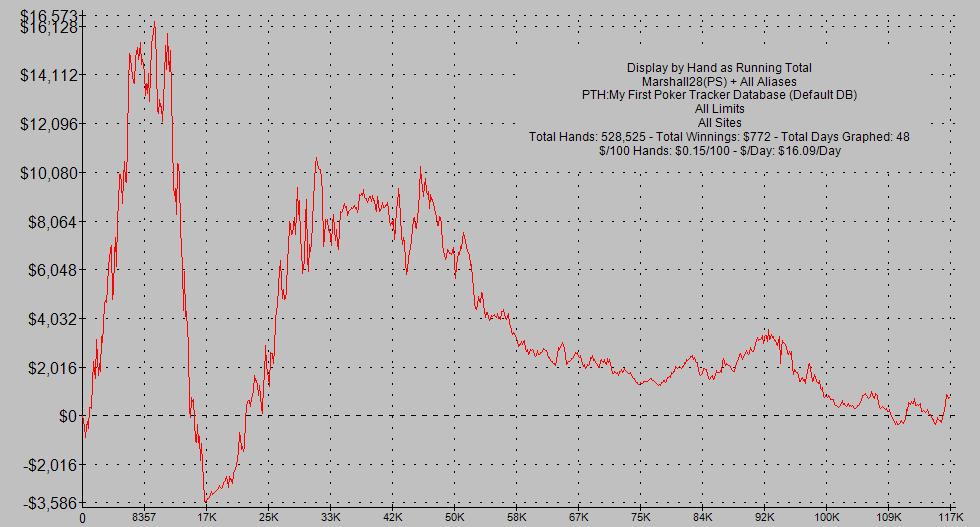
So as my downswing continues, I was hoping I might put up some of the screen shots I got from Poker EV and PokerGrapher so that some kind soul who actually knows how to read the things might interpret them for me in lamen's terms. I took as many different screen shots as I could, hopefully somebody can help me out and explain to me what they mean. Thanks so much...
The only thing missing is roughly 10k hands I played on my laptop at the PCA where I dropped about 8 grand. I tried to have pokerstars e-mail me the hand histories, but for some reason poker tracker wasn't able to handle importing that many files at once, so I wasn't able to get them included.
Anyways, I appreciate any responses as to the interpretation of these graphs.
|
|
|
1
| |
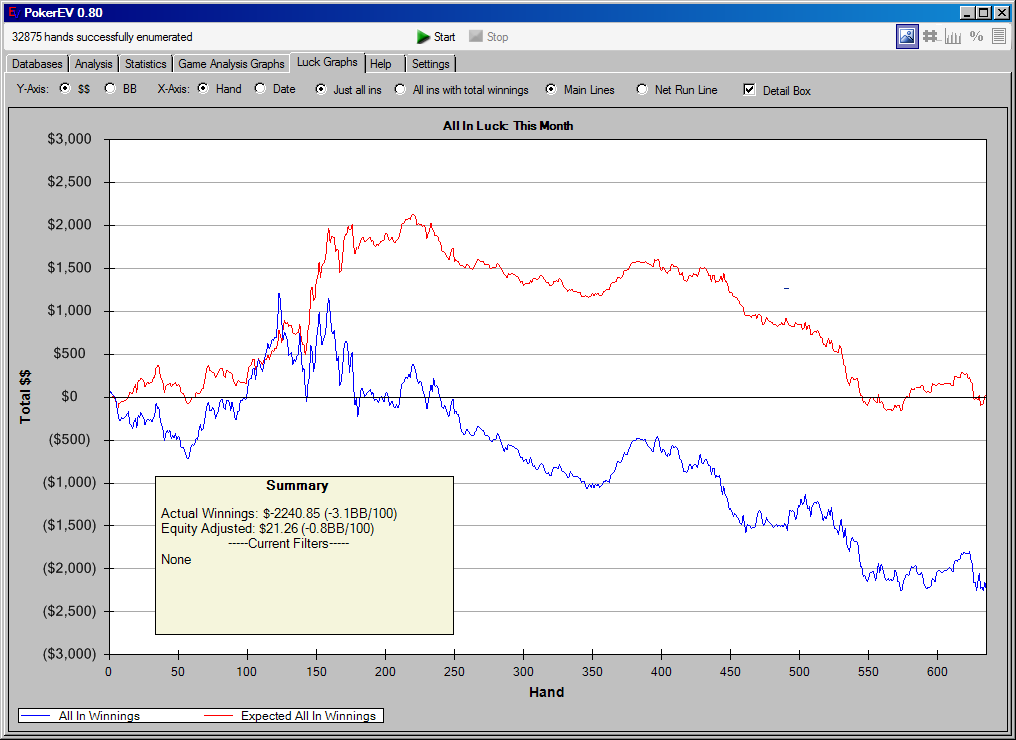
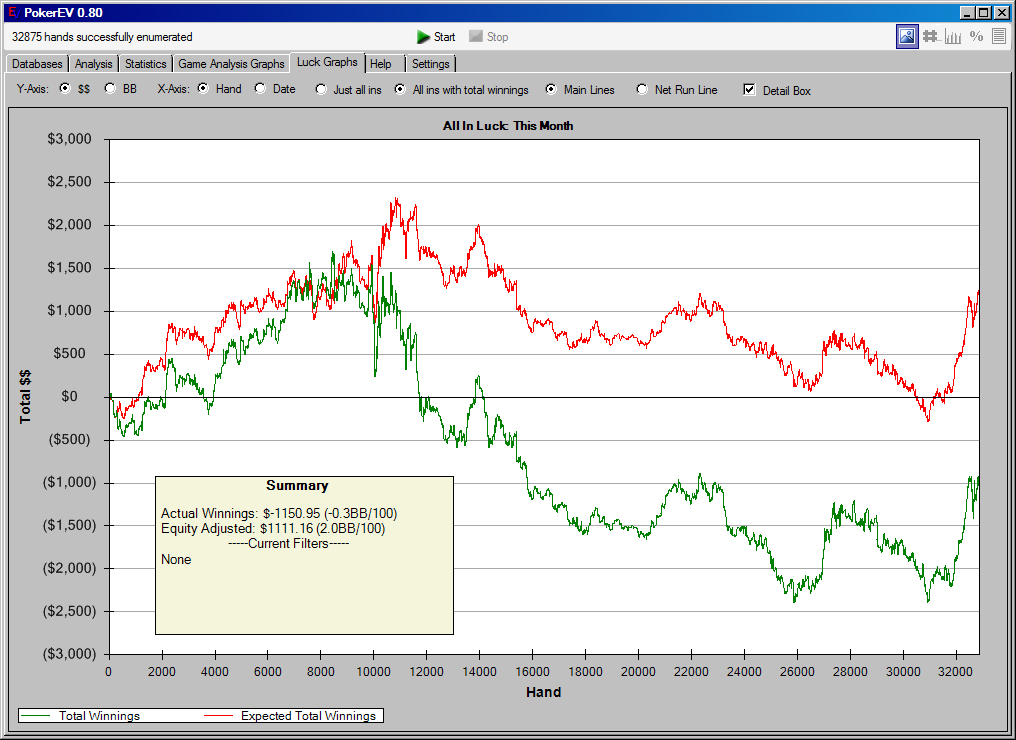
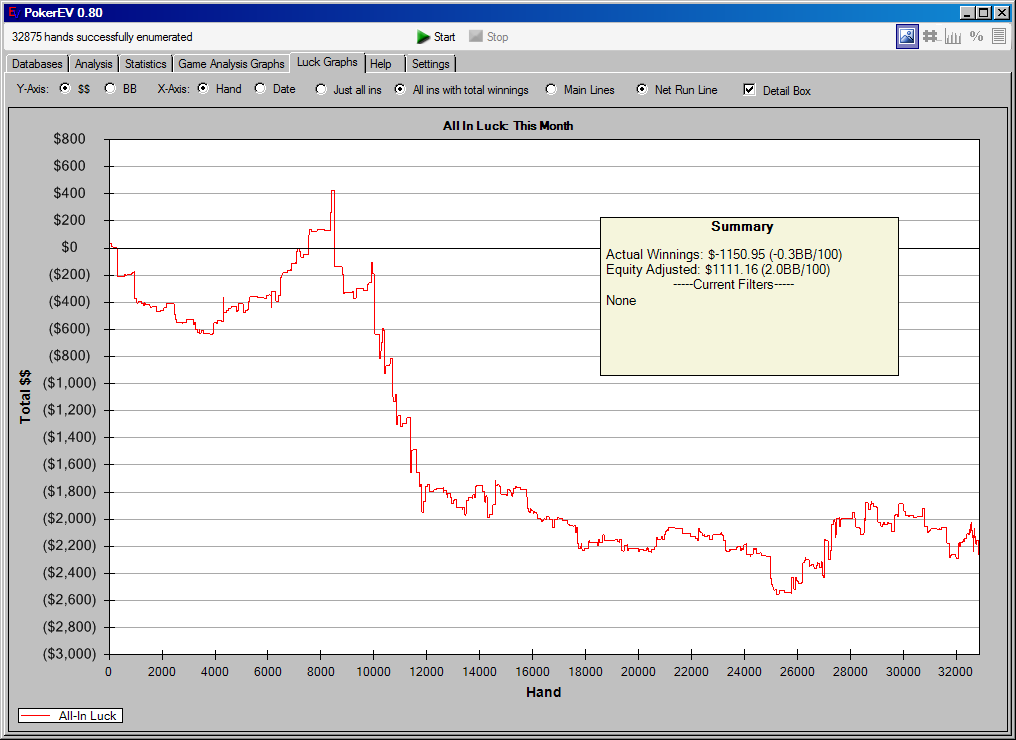
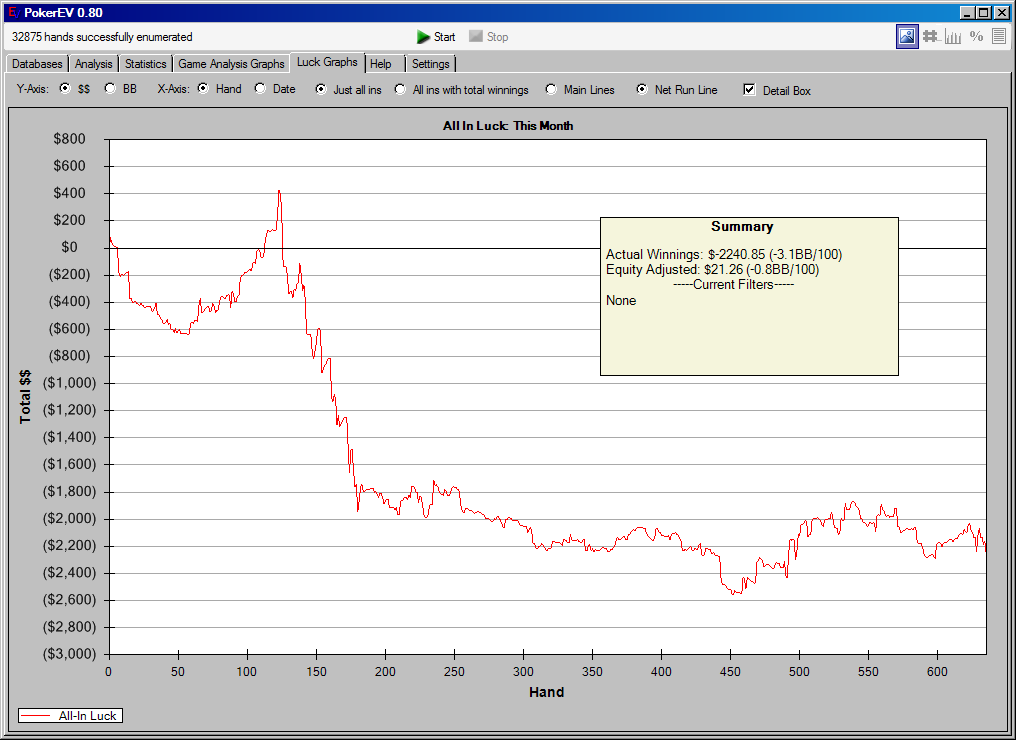
looks like you're running slightly worse after getting it all in, in the last 32k hands.. You are missing about 2k in value. But you can say this is just variance.. The overall trend is downwards though, which means there is a leak (or a few) in your game.. |
|
|
1
 |
lachlan Australia. Feb 06 2008 21:00. Posts 6991 | | |
yeah, you can actually blame this downswing on variance because that ALL-IN luck graph is horrible. thats -$2000 that you normally would have won if you played those hands out like a million times and got the average.
but the thing is you probably had a big UP swing when you were winning a while ago so its just all evening out in the long run. still thats a graph that would make me contemplate digging a hole, lying in it, and shooting myself in the head. 
wait it is only the last 32k hands so ur still probably leaking a bit
try going to analysis tab.. and clicking the filter drop down box at the top and checking all the different hands like small PP's, med PP"s, suited connectors, etc, and see if you are winning or losing with them. |
|
| full ring | Last edit: 06/02/2008 21:03 |
|
|
1
| |
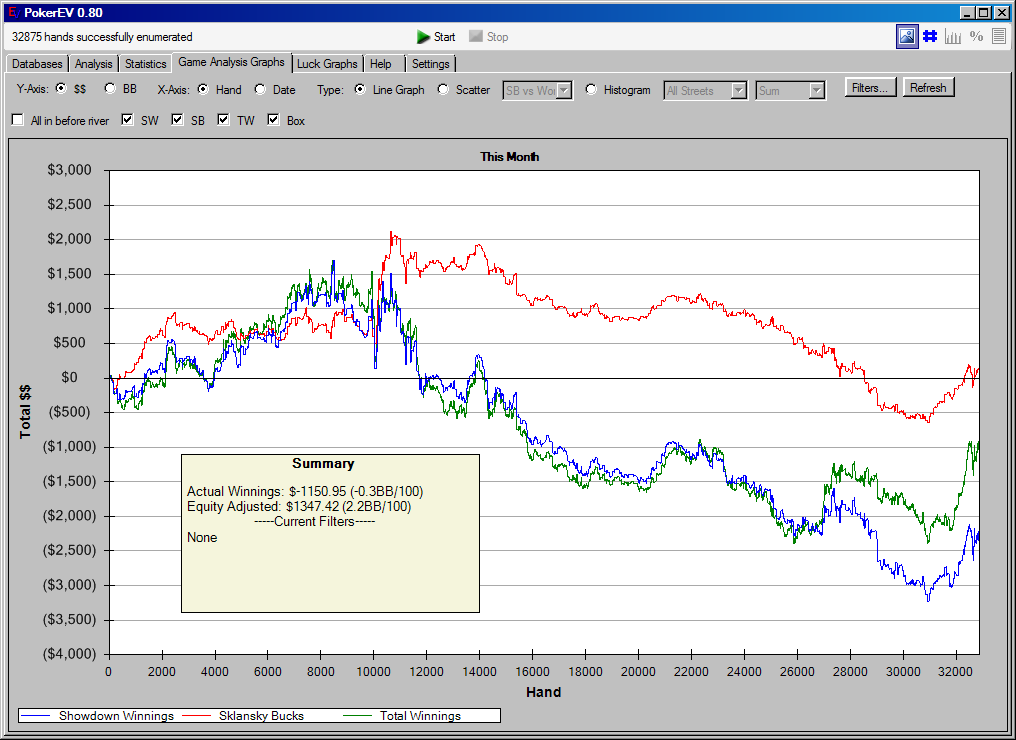
Make an equity graph of when you were running 7BB and compare difference in equity adjusted, this "bad" run is prob no where near the "good" run - it's important to understand and more imporatantly accept that over a large sample everything will balance out, and focus on what matters - playing solid good quality poker.
These graphs are quite honestly quite meaningless, you should review each session individually and objectivley on PT after you are finished playing and check out our play on each given hand using a hand history replayer or something. Cardrunners.com got a cool new HH replayer, where you can upload an entire session and watch the hands play out one by one. |
|
| Our deepest fear is not that we are inadequate. Our deepest fear is that we are powerful beyond measure. It is our light not our darkness that most frightens us and as we let our own lights shine we unconsciously give other people permision to do the same | |
|
|
1
 |
cariadon Estonia. Feb 06 2008 21:58. Posts 4019 | | |
The downswing doesn't continue you continue to play bad. If not bad not too good.
Just admit to palying bad, this is the first step towards healing.
This graph is just going down no matter what.. You have leaks in your standard game, work on those. Preflop ranges, bet sizes, 3bet pots. Get comfortable with playing solid poker. Improve. |
|
|
1
|
MARSHALL28 United States. Feb 06 2008 22:05. Posts 1904 | | |
im not trying to blame running bad for my downswing ... that wasnt the purpose of this, i just wanted to know if there was any knowledge to be gained by means of these graphs about the way i am playing that might lead toward a resolution to the problem. that, or to confirm that this is just mostly a standard run of bad luck (of course im making mistakes, we are all constantly making mistakes every session whether we are killing it or getting killed).
i definitely accept responsibility for my losses, im just trying to figure out how much of this is attributed to bad luck and how much to bad play, i think from that point i can make a much better assessment of what needs to be fixed. im sure this post is really long winded cuz im rambling from being up all night playing 18 hour session. |
|
|
1
 |
Bluffed1331 United States. Feb 06 2008 22:15. Posts 246 | | |
The graphs indicate you suck.. |
| |
|
|
1
|
Bluffed1331 United States. Feb 06 2008 22:15. Posts 246 | | | |
| |
|
|
1
|
JYang United States. Feb 06 2008 22:39. Posts 2669 | | |
lol that graph is so sick |
|
|
1
|
MARSHALL28 United States. Feb 06 2008 23:16. Posts 1904 | | |
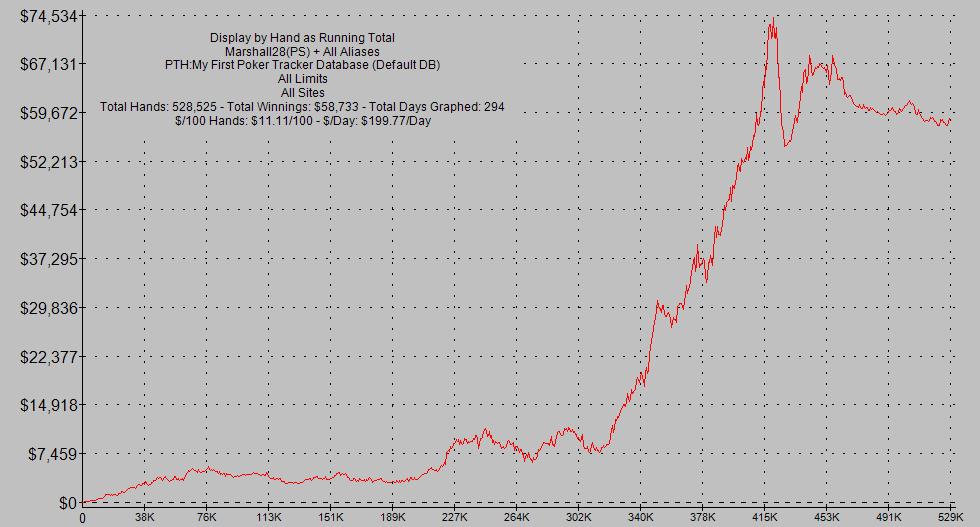
This is my graph beginning from August 2007, so I guess it kinda puts things in perspective...
 |
|
|
1
|
sOah United Kingdom. Feb 06 2008 23:50. Posts 4527 | | |
My personal advice would be to ignore these graphs, there is honestly very little you can draw from them. Go and purchase Hold'em Manager and thank me for it later. |
|
| not all who wander are lost | |
|
|
1
|
MARSHALL28 United States. Feb 07 2008 00:16. Posts 1904 | | |
what's hold em manager do? |
|
|
1
|
1
|
FrinkX United States. Feb 07 2008 00:39. Posts 7562 | | |
ur just running bad keep it up |
|
| bitch on a pension suck my dong | |
|
|
1
 |
brudman Canada. Feb 07 2008 00:48. Posts 615 | | |
tom and evan, you are so right :D |
|
|
|
 Contact Users: 919 Active, 1 Logged in - Time: 08:11


 Canada. Feb 06 2008 21:16. Posts 20070


 ,
,
 ,
,
 ,
,


 ,
,