If you missed my last article as I felt necessary to remove it while I was a bit pissed after more or less debatable ban the day I posted it, here's a link to it:
Managing Highs and Lows
Okay, I spent some time writing this, I hope it deepens your views on the subject and helps you understand why bankroll management is important and also to tailor a good bankroll management strategy for your game.
Bankroll Management Explained
Foreword
This “article” is actually more of a guide to one of the most underrated and yet most important aspects of successful poker. It’s the second longer article I’ve written, first being about managing the highs and lows and how to keep on a good mood for playing poker. Obviously, I’m still learning in the game, so this article forced me to do some research as well and make my knowledge in this area deeper so that I (and soon you) could truly understand what’s it all about. I will mostly concentrate on making similar articles on not-directly-playing related, yet topics instead of going straight on to playing actual hands. There are a lot of better people to write about that. So let’s get started.
Introduction
As mentioned, bankroll management is one of the most underrated aspects of successful poker, not only from the beginning players, but some of the better ones too. Most players are given a strict rule to begin with, such as “You need to have X buy-ins to play at limit Y”. Why is it X? How does it differ from X-1? What is going on in here? People choose, or choose not to follow these restrictions and straying far from the path can result in a lot of tears. I will go into some of the math behind where these numbers come from and why you need to be properly rolled for the game.
Things to remember
Bankroll management is not there to compensate for bad play
This is not only for those beginning the game, but also for those playing higher, more successful, but still out of their bankroll. Many people often move up in limits thinking “Hey, I can beat the game at these limits, I don’t need good bankroll management”. While the first part of it might be true, the second isn’t. Bankroll management is there to negate the effects of hardcore variance. It all comes down to the numbers with this subject and don’t think you can beat the numbers because you can’t. Best you can do is adjust your bankroll management strategy to your winrate and standard deviation (more about those in later chapters) and you will be fine. Then again, if you’re not a winning player, there is no amount of bankroll management that can help you to not go broke.
Standard deviation
Let’s start with an encouraging thought: You can never be 100% certain that you won’t go broke because of bad luck. That being said, there are lots of programs out there to calculate your standard deviation. For example, PokerTracker is capable of doing so.
By definition, Standard Deviation is the measure of fluctuation from the average (mean) value across a range of samples. So basically, the lower the standard deviation is, the more consistent the players results are in that sample. And since calculating your standard deviation can be a pain in the ass, letting programs do it for you is generally the right way to go. Mathematically, it’s calculated by taking a square root of the variance (which is the statistical dispersion of a random variable). More information on how to come up with the standard deviation and related topics can be found here: http://en.wikipedia.org/wiki/Standard_deviation
Risk of Ruin
Also called ROR is what will ultimately decide how safe your bankroll will be. You can basically pick any number smaller than 100% to represent your risk of ruin, ie. How willing are you to go broke. When thinking of a number here, you should start low, lower than 1% because you really don’t want to hit that 1%. And also keep in mind that this does not include things you could possibly cause by yourself, such as tilting that really don’t go into category of variance. Later on, I’ll provide some tables with calculated optimal bankrolls that should suit your needs. It’s always better to have too much, than not enough.
Calculating your optimal bankroll
To the heart of the beast then. First off, you’ll need some statistics from your game. The larger the sample, the better. If you use PokerTracker, that’ll do just fine since you can get all you need from there. Also notice that to give an accurate estimation of what your bankroll should be, you also could need hundreds of thousands of hands to be sure. But few ten thousand should do fine.
The variables needed for the equation are SD (Standard Deviation), HWR (Hourly winrate, ie. BB/100) and ROR (desired Risk of Ruin). After you’ve come up with these numbers, you take the following formula:
The Required Bankroll = -(SD^2/2(*HWR))ln(ROR)
ln being the logarithm with e (2.71828...) as it’s base.
Designing an optimal bankroll management strategy
It is important to make a strategy that you’re comfortable with. Whilst the numbers might suggest a bit smaller number, if you feel uncomfortable playing under those circumstances, by all means, add a few buy-ins to your requirements. Also notice that the numbers that go to that formula are big bets for SD and HWR, instead of PokerTracker BBs (which is 2x BB for no limit). Later on, I will always assume to talk about Big Blinds rather than big bets, so don’t confuse them. I’ve picked a few “reasonable” examples on strategy.
Sample 1
Game: No Limit hold’em
ROR: 1%
HWR: 10 BB/100 (This would be 5 PTBB/100)
SD: 80 BB/100
Bankroll = -(80^2/(2*10))ln(0.01)
= 1473 BB
=~ 15 buy-ins
So this shows that being an okay winner with standard deviation of 80 BB/100, your risk of ruin with 15 buy-ins would be 1%. 1% can still be quite a lot so let’s look into a bit more secure example.
Sample 2
Game: No Limit Hold’em
ROR: 0.01%
HWR: 10 BB/100
SD: 80 BB/100
Bankroll = -(80^2/(2*10))ln(0.0001)
= 2947 BB
=~ 30 buy-ins
This shows that having 30 buy-ins is by the numbers a very safe bankroll to play with and even though the risk still exists, it’s very minimal. It can’t be stressed enough though that should the numbers go bad for you and you lose – say 15 buy-ins of 30 buy-in bankroll, that might really affect your game in a very very bad way, so again, having 30 buy-ins isn’t a guarantee you won’t go broke if you happen to run bad.
Let’s look at an example that goes vice versa. This is kinda for those who think “3 buy-ins is enough” or “I’m good enough to play with X buy-ins”. So we calculate ROR based on the requirements set for bankroll.
Sample 3
Game: No Limit Hold’em
HWR: 10 BB/100
SD: 80 BB/100
ROR: x
Bankroll: 1000 BB (10 buy-ins)
1000 = (-80^2/2*10))ln(x)
ln(x) = 1000/(-320)
ln(x) = -3.125
e^-3.125 = x
x = 4.4%
While this percentage might seem a bit low, take into consideration the times you’ve been runner runner flushed or runner runner rivered – that’s about the same probability. You don’t want that to happen. Granted it’s a risk that some people are willing to take in order to build up fast, but don’t be that person unless you’re willing to put in another 10 buy-ins, should you lose these (in which case you’d basically be playing with 20 buy-in bankroll). Also, the standard deviation in the equation is quite modest, with high fluctuation LAG styles, it can be even bigger and it affects the bankroll requirements.
So let’s take an example of more NL25 kind of approach to go in with $100 and calculate the risk of ruin for that.
Sample 4
Game: No Limit Hold’em (well this doesn’t actually matter, it just illustrates the class the winrates and standard deviations are in. For example SD is lower for Omaha Hi/Lo)
HWR: 10 BB/100 (This could probably be bigger on this level)
SD: 80 BB/100 (Since we’ve used it this far)
ROR: x
Bankroll: 400 BB (4 buy-ins)
ln(x) = 400/(-320)
ln(x) = -1.25
e^-1.25 = x
x = 28.7%
How about that! Doesn’t sound all that shibby anymore. By a bit more than halving the bankroll required for “relatively safe”, the risk of ruin has multiplied to seven times as big. So before thinking you’re good enough to play underrolled, know the risk you’re taking – even with what you’d consider perfect play. Better safe than sorry.
Now that you’ve been walked through the basics on how to calculate your required bankroll, I felt that I could do that for you too, so here are a few tables that show the amount of buy-ins (one buy-in being 100 BB) for different varieties of winrates, standard deviations and risk of ruins. Thank you for your time, I hope you learned something.
Charts
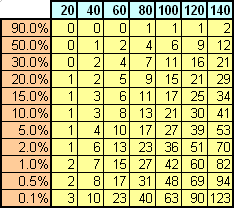
In all the following charts, the percentage on the left will show the ROR and the row name at the top indicates your standard deviation. The numbers in the tables are buy-ins (1 buy-in being 50 BB [100 big blinds]). Remember that these are all big bets, so if you see PokerTracker for your winrate and Standard Deviation, multiply them by two.
Bankroll chart for 5 BB/100 winrate:
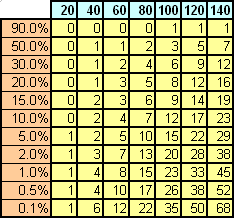
Bankroll chart for 10 BB/100 winrate:
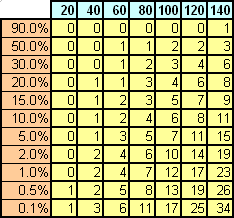
Bankroll chart for 15 BB/100 winrate:

Bankroll chart for 20 BB/100 winrate:
Bankroll chart for 25 BB/100 winrate:

Cheers! <3


|
 Contact Users: 1630 Active, 1 Logged in - Time: 03:59


 Sweden. Jan 27 2007 19:42. Posts 9687


 ,
,
 ,
,
 ,
,


 ,
,